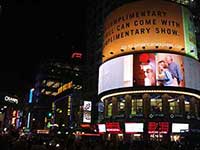
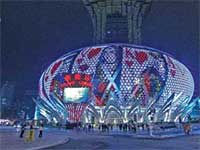
Rating of communicative efficiency of outdoor advertising at the video display
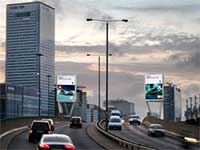
The intensity of pedestrian and transport flows in the district of outdoor display location (the the City “M” Central Square)
The greatest intensity of transport flows, according to the samplings provided, is observed on weekdays (about 50 thousand transport units, 300 thousand pedestrians and passengers). It is much less on Saturday and Sunday (about 35 thousand transport units, 200 thousand pedestrians and passengers). In rush hours 4 thousand transport units pass through the square (about 20 thousand passengers) during 1 hour, the scope of the pedestrians can be about 5 thousand people per 1 hour. The scope of passengers in the transport units passing through the square is generally 3-4 times more than the number of the pedestrians that pass through the square.
Peak time (rush-hour):
- Weekdays -for automobiles and freight transport - 10.00-12.00, 15.00-17.00, for public transport - 9.00-11.00 and 15.00 -18.00.
- On Saturday for automobiles and freight transport - 11.00 - 13.00, for public transport - 12.00 - 16.00.
- On Sunday for automobiles and freight transport - 14.00 - 18.00, for public transport - 13.00 - 15.00 and 17.00 - 19.00.
Rush-hour for the pedestrians:
- Week-days 8.00 - 9.00, 12.00-13.00, 17.00-19.00.
- Saturday 12.00 -14.00, 16.00-18.00.
- Sunday 13.00 -14.00, 17.00-18.00.
Rush-hour for passenger flows:
- On week-days 8.00-10.00, 16.00-18.00.
- On Saturday 12.00-13.00, 15.00-16.00, 18.00-20.00.
- On Sunday 14.00-15.00, 17.00-19.00.
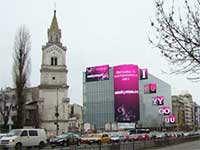
The citizens as potential audience of outdoor advertising at the video display
The share of people visiting the Central Square at least once a month constitutes 52.1% of the city population over 14 years old (about 580, 3 thousand people), at least once a week – 28.9% (about 321.5 thousand people). Taking into account the fact that the samplings were taken in March, it is possible to guess that in summer time the flow can substantially increase.
The share of “constant” audience of the video display (those who visit the square no less than 4-5 times a week) constitutes 24.7%. The visitors of the Central Square have wider geography than the visitors of all the other squares of the city (their visitors are usually the inhabitants of the adjoining districts).
The socio-demographic characteristics of the visitors of the Central Square are the following: young and middle-aged people (elderly people over 50 visits the square more seldom). Those visitors who are engaged in labor sphere are mostly specialists and the heads; those who are unemployed are students and pupils. Such characteristics of potential audience can be attractive to the advertisers, as they represent active part of the population of City M. The advertising influence can bring definite effect.
The greatest inflows of the visitors to the Central Square on weekdays and days off are noticed between 8.00 and 12.00 o'clock in the morning and 18.00-20.00 in the evening. After 20.00 o'clock automobile passengers prevail.
According to the results of the research, the population of City M is well enough informed about the video display: 72.1% know about its existence (about 803.3 thousand people) and 67.7% (754.3 thousand people) saw outdoor display personally when they visited the square or passed through it.
The main advantages of the outdoor display mentioned by the respondents are beauty and brightness of the video display, the ability to attract their attention, granting useful information. The drawbacks are illegibility (unclarity) of the outdoor display image, especially in the afternoon under sunbeams; the unattractiveness of demonstrated advertising, outdoor display location - near the road (it abstracts drivers).
The expectations of the respondents concerning further operation of the outdoor display (besides advertising) are generally connected with the informative side (weather, time, news - city and state, economic, political and sports information, etc.) and entertainment programs (music, cartoons, movies, city measures and holidays). Some respondents suggested outdoor video display’s usage for educational and cognitive purposes, for social advertising.
The pedestrians conceive the outdoor advertising on the display quite ok, the passengers of the automobiles much worse (short period of ad perception, different angles of perception), and the passengers of public transport - worst of all (same reasons + disability to view the ads from an overcrowded means of transport).
The pedestrians at the Central Square: socio-demographic structure, purpose of visiting and contact with outdoor advertising at the video display
1. During the questioning of the pedestrians the share of women prevails over men on week-days. On week-ends it is less, but these discrepancies are insignificant.
2. The most characteristic visitors are young people aged 14-30. Teenagers of 14-19 years old are the prevailing share on days off (21.4% of all the visitors), in the afternoon (18.2%) and in the evening (21.4%) because the representatives of this group come to the square “simply to take a walk” (28.4%). People of 25-35 years old come to the square mostly in the morning.
3. Among the polled population a big part of the respondents has secondary, secondary technical and higher education (86%). The essential discrepancies between the representatives of different educational groups were not noticed on week days, days off and within a day.
4. More than one half of the visitors (52.8%) are working people (and 2.3% are the heads), 24.5% are students and pupils, 4.6% are unemployed, 16.3% - retirees (the percentage is much lower than in the city in general). The structure of the visitors of the square lets us speak about the purposefulness of the outdoor display advertising (directed to the economically active part of the audience) that can promote its efficiency. Such structure of the visitors (regarding employment) causes the large share of working people (60.9%) on week-days and in the morning, whereas on week-ends and in the evening - only 29.3%, students and school children – 29.1%.
5. A large share of the respondents (40.5%) has average and above-average income, which is connected with the large share of employed people in the sampling. There are no essential differences between representatives of different income groups on weekdays and weekends (also within a day).
6. The structure of the visitors regarding the number of members of the family practically corresponds to this criterion in the population of City M. There are no essential discrepancies under the given characteristic among those who visit the square on week days or days-off & within a day (morning, day or evening).
7. There are generally more inhabitants of the Central district and district 1, fewer inhabitants of the 2nd, 3rd and 4th districts. The inhabitants of such remote districts as 5 & 6 appear at the square on week-days and in the morning that is connected with the necessity to go to work/studies. The greatest share on days off (22.9%) and in the evening time (26.9%) is constituted with the inhabitants of the Central district. The share of nonresidents constitutes about 5%.
8. The most frequent reasons for visiting the Central Square are “on business connected with work/studies” or “on the way to work/studies”. On week-days the share of people visiting the square on business (work or studies) or on the way to work/studies is larger than on week-end (one should not forget that the research was undertaken on Saturday, and this day is not a day off for everybody); on week-ends the share of those who simply goes for a walk, to the theatre or concerts prevails.
9. The purposes of visiting the Central Square differ depending on the gender and age of the respondents. So, for example, among those who visit the square on business the share of men is larger than women (50.1% against 35.1%). 15.4% of women and 6.7% of men go shopping in this area. The older are the respondents, the fewer people come to the square just to take a walk. Besides, the young visit restaurants/cafes/bars more often.
10. According to the questioning of the pedestrians, 40% of the visitors of the square spend no more than 5 minutes there, 60% - no more than 10 minutes, 80% - no more than half an hour. Only about 20% of the visitors spend there more than half an hour.
11. 65.4% of the visitors pay attention to the outdoor video display (it shows the efficiency of the ad carrier from the point of view of drawing attention). The large share of those who do not pay attention to the image transmitted through the outdoor display (54.9%) do not linger about the square more than five minutes. 50% of the visitors who pay attention to the outdoor display look at the display no more than 30 seconds, 75% - no more than a minute. Therefore optimal duration of a clip should not exceed 30 seconds.
12. 40.7% of the polled pedestrians not only paid attention to the outdoor video display, but also remembered advertising clips which were transmitted. It is a high index taking into account short contact time and not importunate character of ad demonstration.